I like colorful plots. They may cost alot to publish in a research journal but they're just so pretty. Quite a few blogs have been written ranting about rainbow colormaps and also about how to choose really good colormaps.
This blog is devoted to practical tools I use to help me with colormapping. The actual code is in a github gist of Matplotlib Colormap Tools
Some other useful colormap links
For general color layouts:
- Colorbrewer
- Paletton - a really cool color scheme tool which includes tools to filter by colorblindness
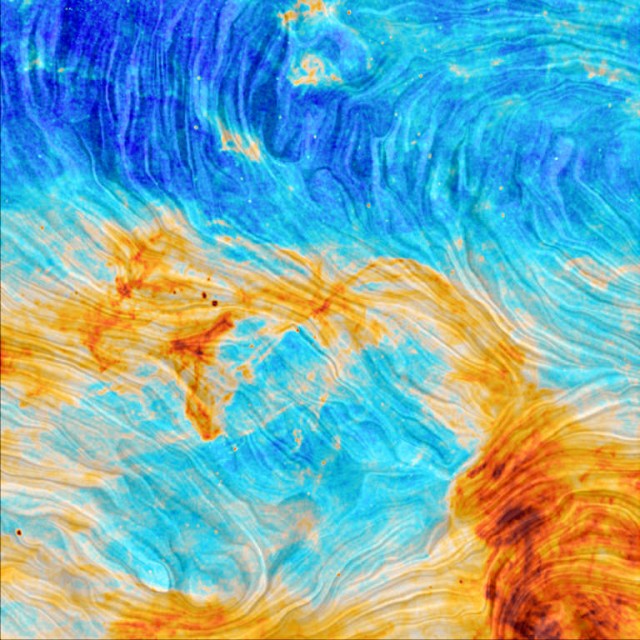
Below is a really cool colormap image of the Milky Way's magnetic field captured by the Planck spacecraft

Colormap Reference
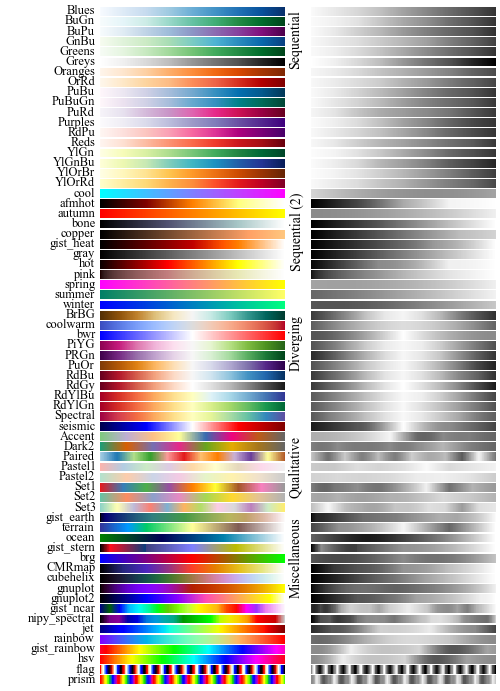
Several colormap references scripts/functions exist; mine is better (haha). In my Matplotlib Colormap Tools file I have a function called show_mpl_cmaps. This uses a lookup table to group together relevant colormaps and a graifier to also show what that colormap looks like in gray scale. I've added this to my PYTHONSTARTUP script so when I need a quick reference I can just open a terminal and type show_mpl_cmaps() to get:
 {}
{}
Truncating Colormaps
Search Keywords: Reducing color range, shorten colormap, remove white from colormap
I searched for a while and could find something that made a colormap cut off certain colors. For example, taking the plt.cm.rainbow and reducing it to only blue to orange (I know rainbow is terrible, but humor me). Or you want to use plt.cm.gist_heat but cut off the white top.
I hope if you're reading this I can save you some time in having already worked out a good way to truncate a colormap. It's a pretty short function I called truncate_cmap which I've included in Matplotlib Colormap Tools gist.
plt.colormap(plt.imshow(cnts,cmap=plt.cm.rainbow))

plt.colormap(plt.imshow(cnts,cmap=truncate_cmap(plt.cm.rainbow,n_min=40,n_max=210))

The MonoColorMap
The final tool I'll leave you with is my own...MonoColormap. It's a silly colormap which always returns the same color (hence mono-color). You instantiate it cmap=MonoColormap('r') and can use any maplotlib color or hex color. I found it useful when I wanted to overplot some image but just have it gray out with some opacity. It's also located in Matplotlib Colormap Tools gist.
